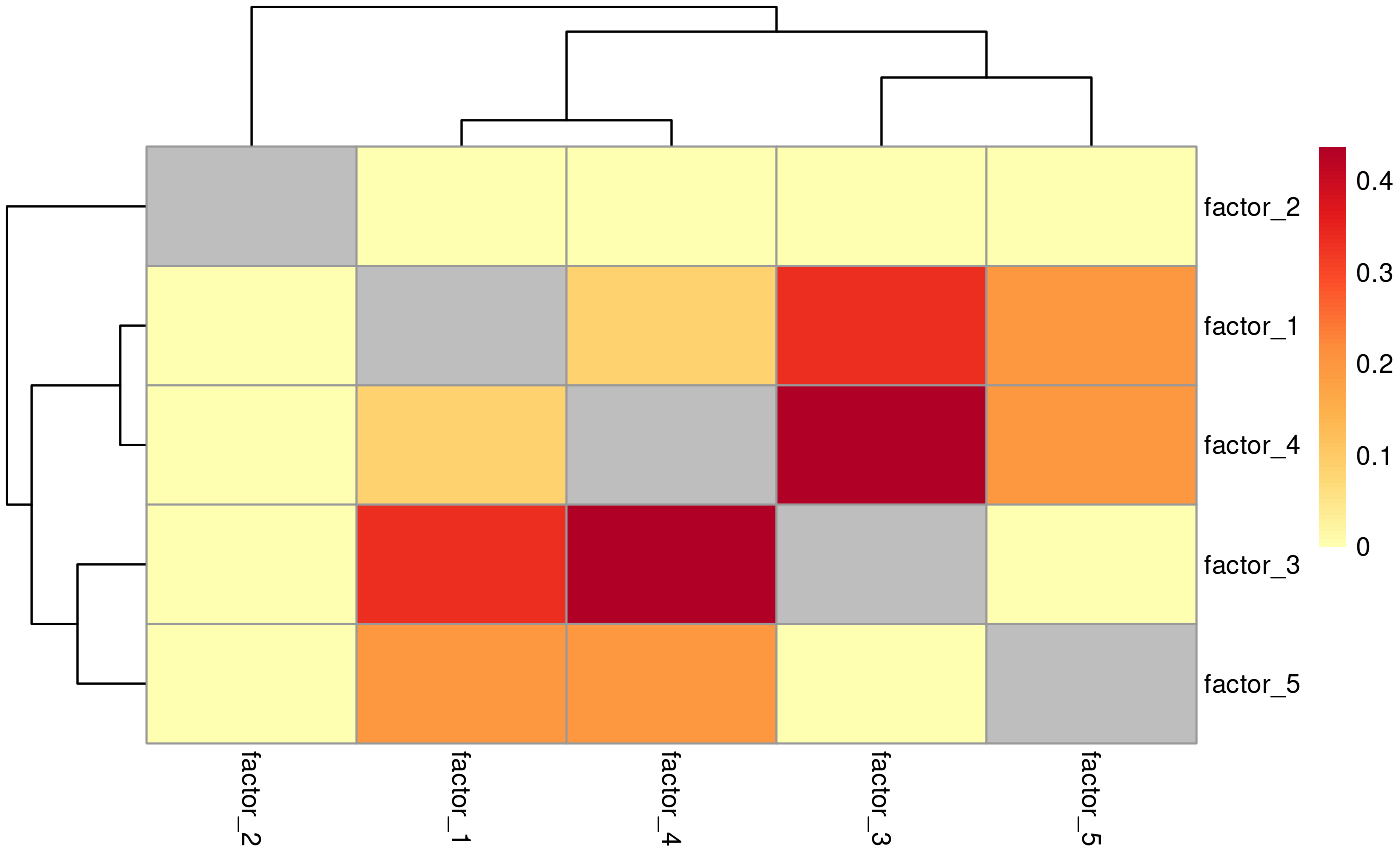
Heatmap comparing commonality across factors
Usage
plotCommonFeatures(
  common_features,
  filename = NA,
  color = (grDevices::colorRampPalette(RColorBrewer::brewer.pal(n = 7, name =
    "YlOrRd")))(100)
)
Arguments
- common_features
The output of getCommonFeatures.
- filename
The path at which to save the plot.
- color
The colour palette to be used in the heatmap.
Value
An object generated by pheatmap.
Examples
# Get a random matrix with rnorm, with 100 rows (features)
# and 20 columns (observations)
X <- ReducedExperiment:::.makeRandomData(100, 20, "feature", "obs")

# Estimate 5 factors based on the data matrix
fe <- estimateFactors(X, nc = 5)

# Get the genes highly aligned with each factor
aligned_features <- getAlignedFeatures(
    fe,
    format = "data.frame",
    proportional_threshold = 0.3
)

# Identify overlap between common features for each factor
common_features <- getCommonFeatures(aligned_features)

# Plot the common features as a heatmap
plotCommonFeatures(common_features)