Plots the dendrogram in the dendrogam slot of a
ModularExperiment object using the
plotDendroAndColors function.
Usage
# S4 method for class 'ModularExperiment'
plotDendro(
  object,
  groupLabels = "Module colors",
  dendroLabels = FALSE,
  hang = 0.03,
  addGuide = TRUE,
  guideHang = 0.05,
  color_func = WGCNA::labels2colors,
  modules_are_colors = FALSE,
  ...
)
Arguments
- object
ModularExperiment object.
- groupLabels
Module label axis label. See plotDendroAndColors.
- dendroLabels
If
TRUE, shows feature names in the dendrogram. See plotDendroAndColors.- hang
The fraction of the plot height by which labels should hang below the rest of the plot. See plot.hclust.
- addGuide
If
TRUE, adds vertical guide lines to the dendrogram. See plotDendroAndColors.- guideHang
The fraction of the dendrogram's height to leave between the top end of the guide line and the dendrogram merge height. See plotDendroAndColors.
- color_func
Function for converting module names to colors. Only used if
modules_are_colorsisFALSE.- modules_are_colors
If
TRUE, expects the module names to be colors. Else, assumes that module names are are numbers that can be converted into colours bycolor_func.- ...
Additional arguments to be passed to plotDendroAndColors.
Value
A plot produced by plotDendroAndColors.
Examples
# Create ModularExperiment with random data (100 features, 50 samples,
# 10 modules)
me <- ReducedExperiment:::.createRandomisedModularExperiment(100, 50, 10)
me
#> class: ModularExperiment
#> dim: 100 50 10
#> metadata(0):
#> assays(1): normal
#> rownames(100): gene_1 gene_2 ... gene_99 gene_100
#> rowData names(0):
#> colnames(50): sample_1 sample_2 ... sample_49 sample_50
#> colData names(0):
#> 10 components
# The dendrogram is usually produced during module discovery, but we can
# assign any dendrogram to the slot. Let's do hierarchical clustering on the
# features in our object and assign it
dendrogram(me) <- hclust(dist(assay(me)))
dendrogram(me)
#>
#> Call:
#> hclust(d = dist(assay(me)))
#>
#> Cluster method : complete
#> Distance : euclidean
#> Number of objects: 100
#>
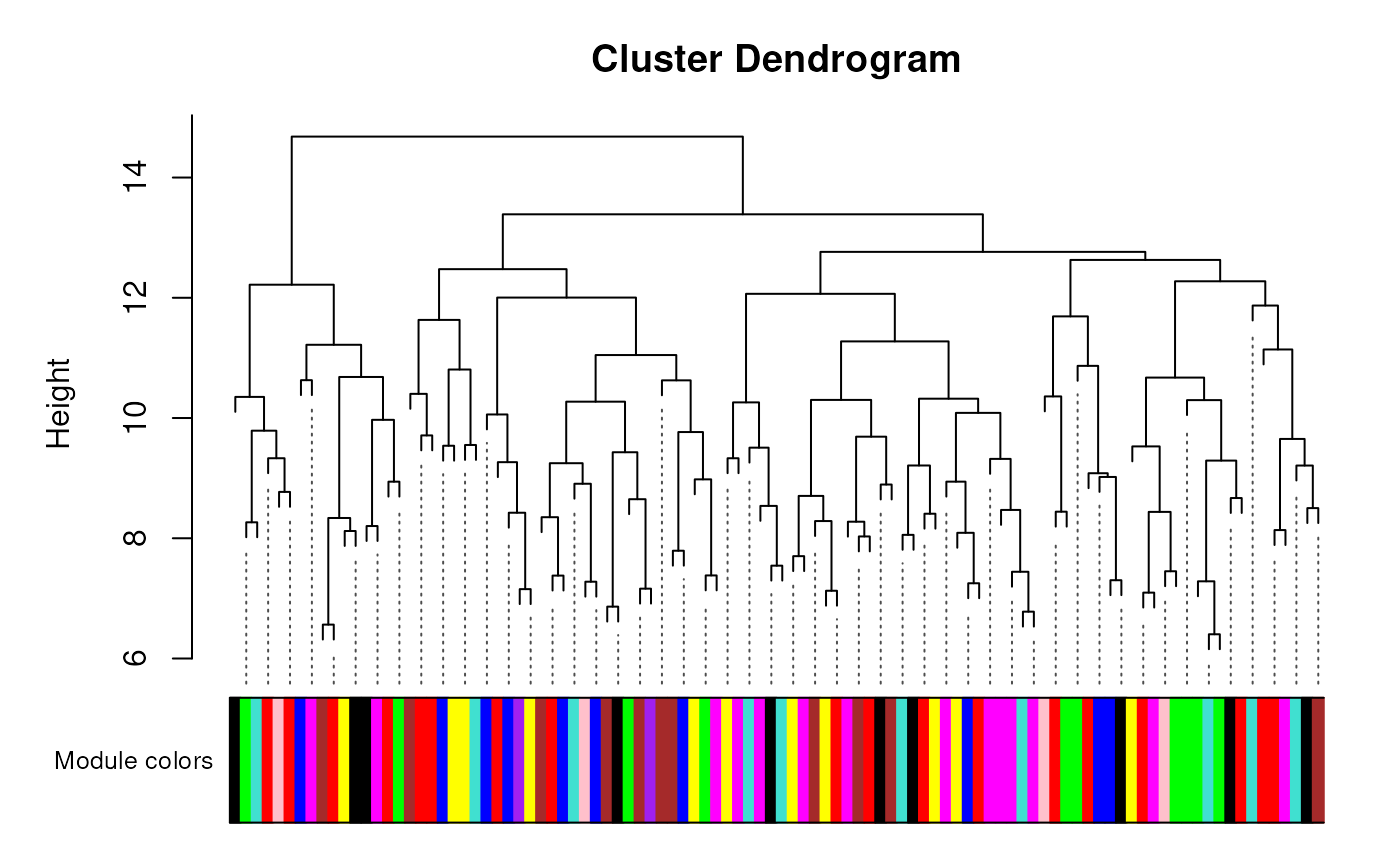
# Plot the dendrogram - modules are random in this instance, but in general
# features within a module should cluster together
plotDendro(me)